Market Outlook
July13, 2017
Market Cues
Domestic Indices
Chg (%)
(Pts)
(Close)
Indian markets are likely to open on positive note tracking SGX Nifty and global
BSE Sensex
0.2
58
31,805
indices.
Nifty
0.3
30
9,816
U.S. stocks closed higher on Wednesday with the Dow industrials setting its first
Mid Cap
1.1
161
15,084
closing record in nearly a month as Federal Reserve Chairwoman Janet Yellen
Small Cap
0.6
191
15,897
emphasized the central bank’s gradual approach to normalizing monetary policy
Bankex
0.5
135
26,802
and expressed optimism about the economy in congressional testimony. The Dow
Jones Industrials average closed up 0.6%, at 21,532, its first new closing high since
June 19.The SPX500 advanced 0.7% to finish at 2,443.Meanwhile, the Nasdaq100
Global Indices
Chg (%)
(Pts)
(Close)
rose 1.10% to close at 6,262, for a fourth straight day of gains.
Dow Jones
0.6
123
21,532
U.K. stocks gained by the most since April after FED chairwoman suggested interest
Nasdaq
1.1
68
6,261
rates won’t need to rise much further to put monetary policy on a neutral footing. A
FTSE
1.2
87
7,417
gain for luxury-goods maker Burberry Group PLC also contributed to the push
Nikkei
(0.5)
(97)
20,098
higher on the FTSE 100. The London benchmark UKX, climbed 1.2% to close at
Hang Seng
0.6
166
26,044
7,417.
Shanghai Com
(0.2)
(5)
3,198
Domestic front, Equity benchmarks continued to end at record closing highs on
Wednesday, with the Nifty holding 9,800 level for the first time. Yesterday rally
Advances / Declines
BSE
NSE
largely driven by oil stocks. The 30-share BSE Sensex was up 0.2% at 31,805 and
Advances
1,470
1,980
the 50-share NSE Nifty rose 0.3% to close at 9,816.
Declines
1,230
705
News Analysis
Unchanged
155
89
TCS (CMP: `2,493/ TP: `2,651/Upside: 8.7%)
CPI inflation slows to 1.54%, IIP at 1.72%
Volumes (` Cr)
Detailed analysis is on Pg2
BSE
3,748
NSE
25,005
Investor’s Ready Reckoner
Key Domestic & Global Indicators
#Net Inflows (` Cr)
Net
Mtd
Ytd
Stock Watch: Latest investment recommendations on 150+ stocks
FII
(56162
(1,581)
54,327
Refer Pg6 onwards
MFs
8797
3,166
42,312
Top Picks
CMP
Target
Upside
Company
Sector
Rating
Top Gainers
Price (`)
Chg (%)
(`)
(`)
(%)
Bioconm
367
13.7
Blue Star
Capital Goods
Buy
618
760
23.0
Dewan Housing FinanceFinancials
Buy
435
520
19.6
Sintex
30
12.4
Mahindra Lifespace
Real Estate
Buy
441
522
18.4
Ptc
111
10.5
Navkar Corporation
Others
Buy
206
265
28.6
Adanient
141
5.9
KEI Industries
Capital Goods
Accumulate
232
258
11.1
More Top Picks on Pg3
Ncc
94
5.8
Key Upcoming Events
Top Losers
Price (`)
Chg (%)
Previous
Consensus
Date
Region
Event Description
Reading
Expectations
Unitech
247
(5.0)
Jul 13, 2017
US
Producer Price Index (mom)
(0.70)
Gmrinfra
18
(2.4)
Jul13, 2017
US
Initial Jobless claims
248.00
245.00
Niittech
577
(2.0)
Jul 13, 2017
China
Exports YoY%
8.70
8.90
Mindtree
515
(1.8)
Jul 14, 2017
US
Industrial Production
-
0.30
Jul 14, 2017
India
Imports YoY%
33.10
Adanitrans
125
(1.8)
More Events on Pg4
#as on 12t July, 2017
Market Outlook
July13, 2017
News Analysis
TCS (CMP: `2,493/ TP: `2,651/Upside: 8.7%)
TCS is slated to announce its 1QFY2018 results today. We expect the company to
post 3.0% sequential growth in USD revenues to US$4,585mn, mostly volume
lead. In rupee terms, revenues are expected to come in at `29,600cr, down 0.1%.
qoq. EBIT margin is expected to show decline of ~148bp qoq to end at 24.2%.
Impact of wage hikes and visa expenses, apart from rupee appreciation is
expected to be the major drag for profitability. Consequently, PAT is expected to be
at `6,275cr, de-growth of 5.0% qoq. We maintain our accumulate rating on the
stock with a target price of `2,651.
Y/E
Sales OPM
PAT
EPS ROE P/E P/BV EV/EBITDA EV/Sales
March
(` cr)
(%)
(` cr)
(`)
(%)
(x)
(x)
(x)
(x)
FY2018E
1,27,403
27.6
28,272
144.5
29.7
16.4
5.0
12.0
3.3
FY2019E
1,38,870
27.6
30,524
156.0
29.8
15.6
4.7
10.8
3.0
CPI inflation slows to 1.54%, IIP at 1.72%
Retail inflation dipped to a record low in June on the back of sliding food prices,
while industrial output growth slowed in May as manufacturing remained sluggish.
Data released by the Central Statistics Office (CSO) on Wednesday showed retail
inflation, as measured by the consumer price index (CPI), rose an annual 1.5% in
June, slower than previous month's 2.2%.
Economic and Political News
Retail inflation dips to record low in June, IIP slows in May
Bond market buzzing as foreign investors pump $1.2 bn in a single day
Corporate News
Tata Motors in focus as JLR global wholesales fall 2 percent year-on-year
Kirloskar Ferrous shuts one mini blast furnace due to market conditions
BEML: Signs pact with National Law School for capacity enhancement.
Market Outlook
July13, 2017
Top Picks ★★★★★
Market Cap
CMP
Target
Upside
Company
Rationale
(` Cr)
(`)
(`)
(%)
Strong growth in domestic business due to its leadership
in acute therapeutic segment. Alkem expects to launch
Alkem Laboratories
21,541
1,802
2,161
19.9
more products in USA, which bodes for its international
business.
We expect the company would report strong profitability
Asian Granito
1,346
447
480
7.3
owing to better product mix, higher B2C sales and
amalgamation synergy.
Favourable outlook for the AC industry to augur well for
Cooling products business which is out pacing the market
Blue Star
5,910
618
760
23.0
growth. EMPPAC division's profitability to improve once
operating environment turns around.
With a focus on the low and medium income (LMI)
consumer segment, the company has increased its
Dewan Housing Finance
13,636
435
520
19.6
presence in tier-II & III cities where the growth opportunity
is immense.
Loan growth is likely to pick up after a sluggish FY17.
Karur Vysya Bank
8,340
138
160
15.9
Lower credit cost will help in strong bottomline growth.
Increasing share of CASA will help in NIM improvement.
High order book execution in EPC segment, rising B2C
KEI Industries
1,806
232
258
11.1
sales and higher exports to boost the revenues and
profitability
Speedier execution and speedier sales, strong revenue
Mahindra Lifespace
2,263
441
522
18.4
visibilty in short-to-long run, attractive valuations
Massive capacity expansion along with rail advantage at
Navkar Corporation
2,938
206
265
28.6
ICD as well CFS augurs well for the company
Strong brands and distribution network would boost
Siyaram Silk Mills
2,158
2,303
2,500
8.6
growth going ahead. Stock currently trades at an
inexpensive valuation.
Market leadership in Hindi news genre and no.
2
viewership ranking in English news genre, exit from the
TV Today Network
1,522
255
344
34.8
radio business, and anticipated growth in ad spends by
corporates to benefit the stock.
After GST, the company is expected to see higher
volumes along with improving product mix. The Gujarat
Maruti
2,25,812
7,475
8,495
13.6
plant will also enable higher operating leverage which
will be margin accretive.
Source: Company, Angel Research,
Market Outlook
July13, 2017
Quarterly Bloomberg Brokers Consensus Estimate
Tata Consultancy Services Ltd Consol - July 13, 2017
Particulars ( ` cr)
1QFY18E
1QFY17
y-o-y (%)
4QFY17
q-o-q (%)
Net sales
29,579
29,305
0.9
29,642
(0.2)
EBITDA
7,726
7,838
(1.4)
8,132
(5.0)
EBITDA margin (%)
26.1
26.7
27.4
Net profit
6,200
6,317
(1.9)
6,608
(6.2)
Infosys Ltd Consol - July 14, 2017
Particulars ( ` cr)
1QFY18E
1QFY17
y-o-y (%)
4QFY17
q-o-q (%)
Net sales
16,998
16,782
1.3
17,120
(0.7)
EBITDA
4,463
4,447
0.3
4,658
(4.2)
EBITDA margin (%)
26.3
26.5
27.2
Net profit
3,429
3,436
(0.2)
3,603
(4.8)
ACC Ltd - July 17, 2017
Particulars ( ` cr)
2QCY17E
2QCY16
y-o-y (%)
1QCY17
q-o-q (%)
Net sales
3,263
2,870
13.7
3,557
(8.3)
EBITDA
454
457
(0.6)
416
9.1
EBITDA margin (%)
13.9
15.9
11.7
Net profit
246
238
3.5
212
16.4
Ultratech Cement Ltd - July 18, 2017
Particulars ( ` cr)
1QFY18E
1QFY17
y-o-y (%)
4QFY17
q-o-q (%)
Net sales
6,784
6,182
9.7
6,595
2.9
EBITDA
1,453
1,423
2.1
1,278
13.7
EBITDA margin (%)
21.4
23.0
19.4
Net profit
785
775
1.2
688
14.0
Market Outlook
July 13, 2017
Key Upcoming Events
Global economic events release calendar
Bl oomberg Data
D ate
Time
C ountry
Event Description
Unit
Period
L ast Reporte d
E stimate d
Jul 13, 2017
US
Producer Price Index (mom)
% Change
Jun
(0.70)
6:00 PM US
Initial Jobless claims
Thousands
Jul 8
248.00
245.00
China
Exports YoY%
% Change
Jun
8.70
8.90
Jul 14, 2017
6:45 PM US
Industrial Production
%
Jun
-
0.30
India
Imports YoY%
% Change
Jun
33.10
India
Exports YoY%
% Change
Jun
8.30
6:00 PM US
Consumer price index (mom)
% Change
Jun
(0.10)
0.10
12: 00 PM India
Monthly Wholesale Prices YoY%
% Change
Jun
2.17
1.39
Jul 17, 2017
7:30 AM China
Industrial Production (YoY)
% Change
Jun
6.50
6.50
7:30 AM China
Real GDP (YoY)
% Change
2Q
6.90
6.80
Jul 18, 2017
2:30 PM Euro Zone
Euro-Zone CPI (YoY)
%
Jun F
1.30
2:00 PM UK
CPI (YoY)
% Change
Jun
2.90
Jul 19, 2017
6:00 PM US
Housi ng Starts
Thousands
Jun
1,092.00
1,170.00
6:00 PM US
Building permits
Thousands
Jun
1,168.00
1,210.00
Jul 20, 2017
7:30 PM Euro Zone
Euro-Zone Consumer Confidence
Value
Jul A
(1.30)
1:00 PM Germany
PMI Services
Value
Jul P
54.00
Jul 24, 2017
5:15 PM Euro Zone
ECB announces interest rates
%
Jul 20
-
1:00 PM Germany
PMI Manufacturing
Value
Jul P
59.60
7:30 PM US
Existing home sales
Million
Jun
5.62
5.65
Jul 25, 2017
7:30 PM US
Consumer Confidence
S.A./ 1985=100
Jul
118.90
118.00
Jul 26, 2017
2:00 PM UK
GDP (YoY)
% Change
2Q A
2.00
Source: Bloomberg, Angel Research
Market Outlook
July 13, 2017
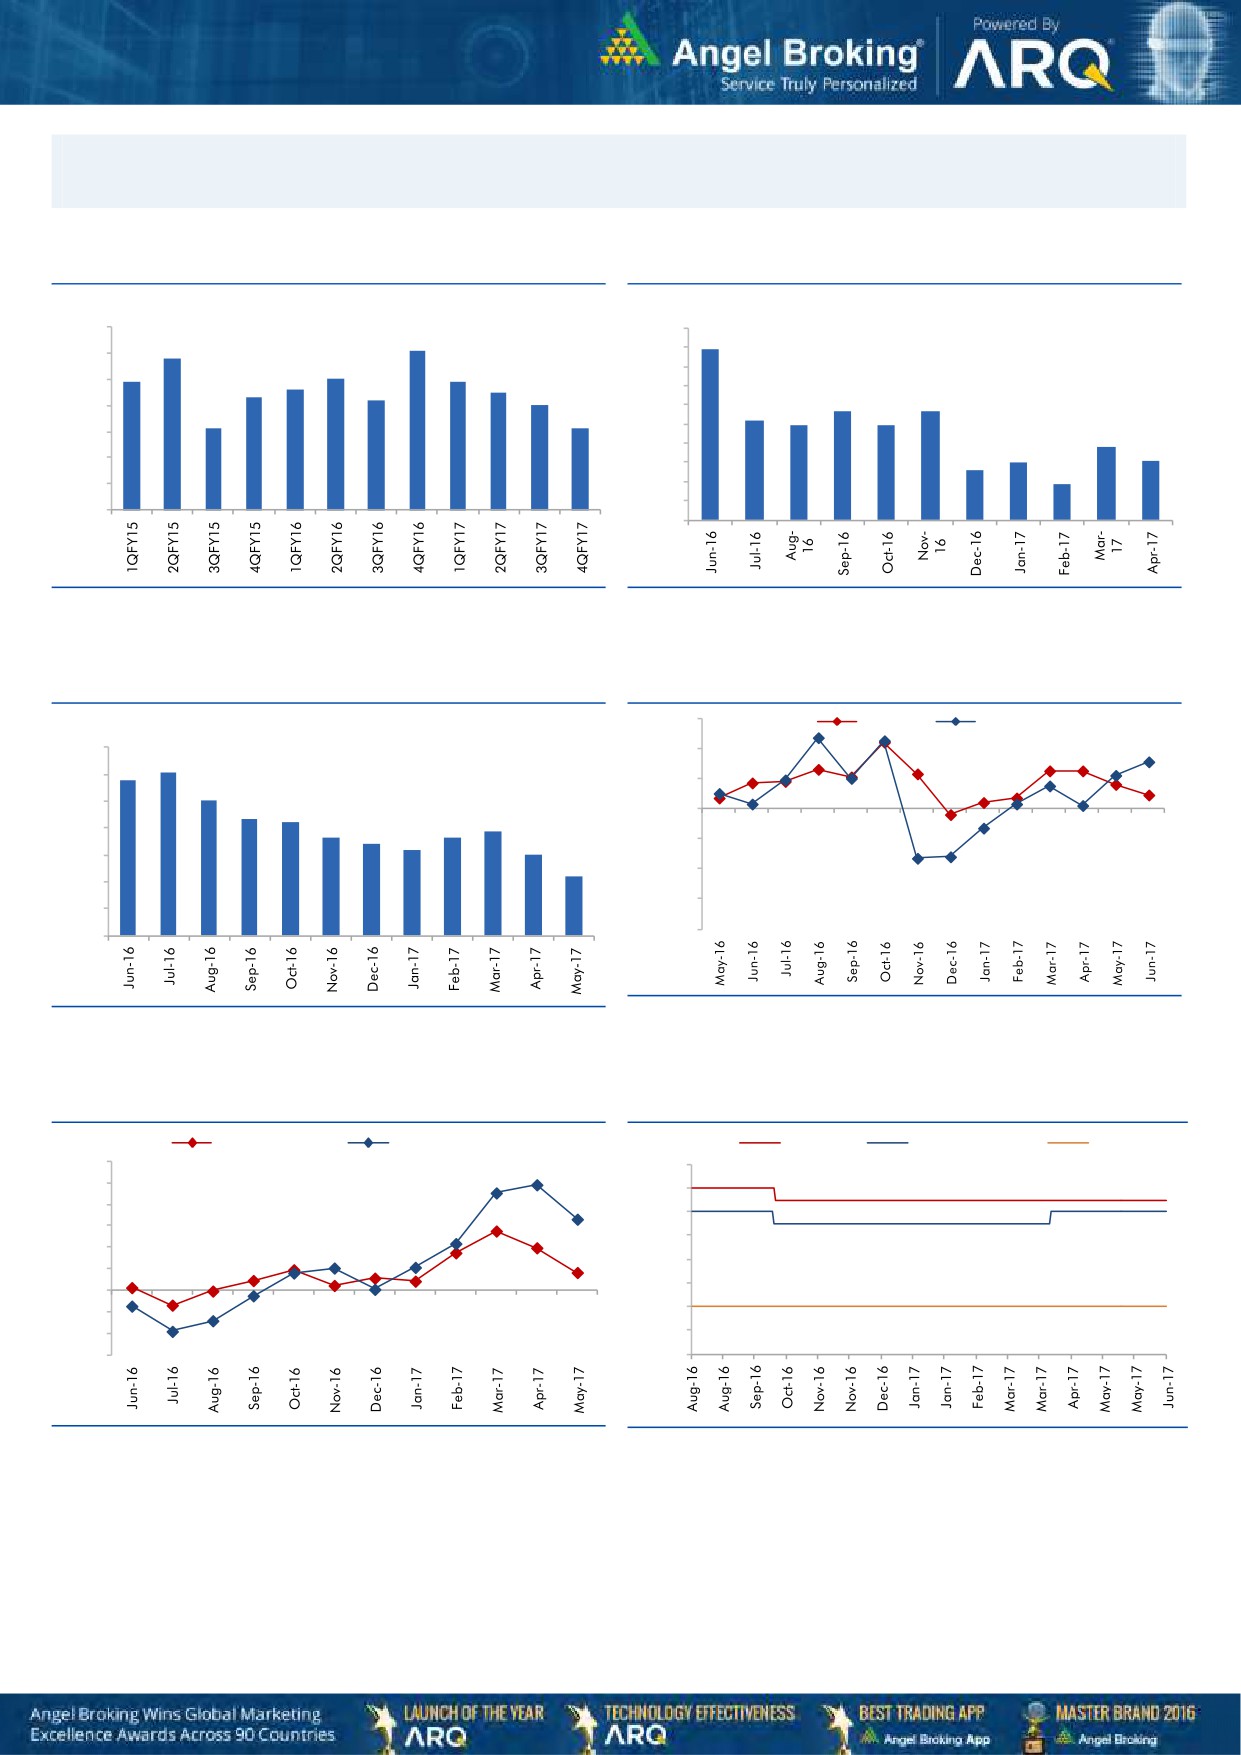
Macro watch
Exhibit 1: Quarterly GDP trends
Exhibit 2: IIP trends
(%)
(%)
10.0
10.0
9.1
8.9
8.8
9.0
9.0
7.9
8.0
7.9
8.0
7.6
7.5
8.0
7.3
7.2
7.0
7.0
5.7
5.7
7.0
6.0
5.2
6.1
6.1
4.9
4.9
6.0
5.0
3.8
4.0
3.0
3.1
2.6
5.0
3.0
1.9
4.0
2.0
1.0
3.0
-
Source: CSO, Angel Research
Source: MOSPI, Angel Research
Exhibit 3: Monthly CPI inflation trends
Exhibit 4: Manufacturing and services PMI
56.0
Mfg. PMI
Services PMI
(%)
7.0
54.0
6.1
5.8
6.0
52.0
5.1
5.0
4.3
4.2
3.9
50.0
3.6
3.7
4.0
3.4
3.2
3.0
48.0
3.0
2.2
46.0
2.0
44.0
1.0
42.0
-
Source: Market, Angel Research; Note: Level above 50 indicates expansion
Source: MOSPI, Angel Research
Exhibit 5: Exports and imports growth trends
Exhibit 6: Key policy rates
(%)
Exports yoy growth
Imports yoy growth
(%)
Repo rate
Reverse Repo rate
CRR
60.0
7.00
50.0
6.50
40.0
6.00
30.0
5.50
20.0
5.00
10.0
4.50
0.0
4.00
(10.0)
(20.0)
3.50
(30.0)
3.00
Source: Bloomberg, Angel Research
Source: RBI, Angel Research
Market Outlook
July 13, 2017
Global watch
Exhibit 1: Latest quarterly GDP Growth (%, yoy) across select developing and developed countries
(%)
8.0
6.9
7.0
5.6
6.0
5.3
5.0
1.0
5.0
4.0
3.3
2.9
3.0
2.0
2.0
0.5
2.0
1.1
1.3
1.0
-
(1.0)
(0.4)
Source: Bloomberg, Angel Research
Exhibit 2: 2016 GDP Growth projection by IMF (%, yoy) across select developing and developed countries
(%)
7.2
7.0
6.6
6.0
5.1
5.0
4.5
4.0
3.0
3.0
2.3
2.0
1.4
1.6
2.0
1.4
1.2
0.2
0.8
1.0
-
Source: IMF, Angel Research
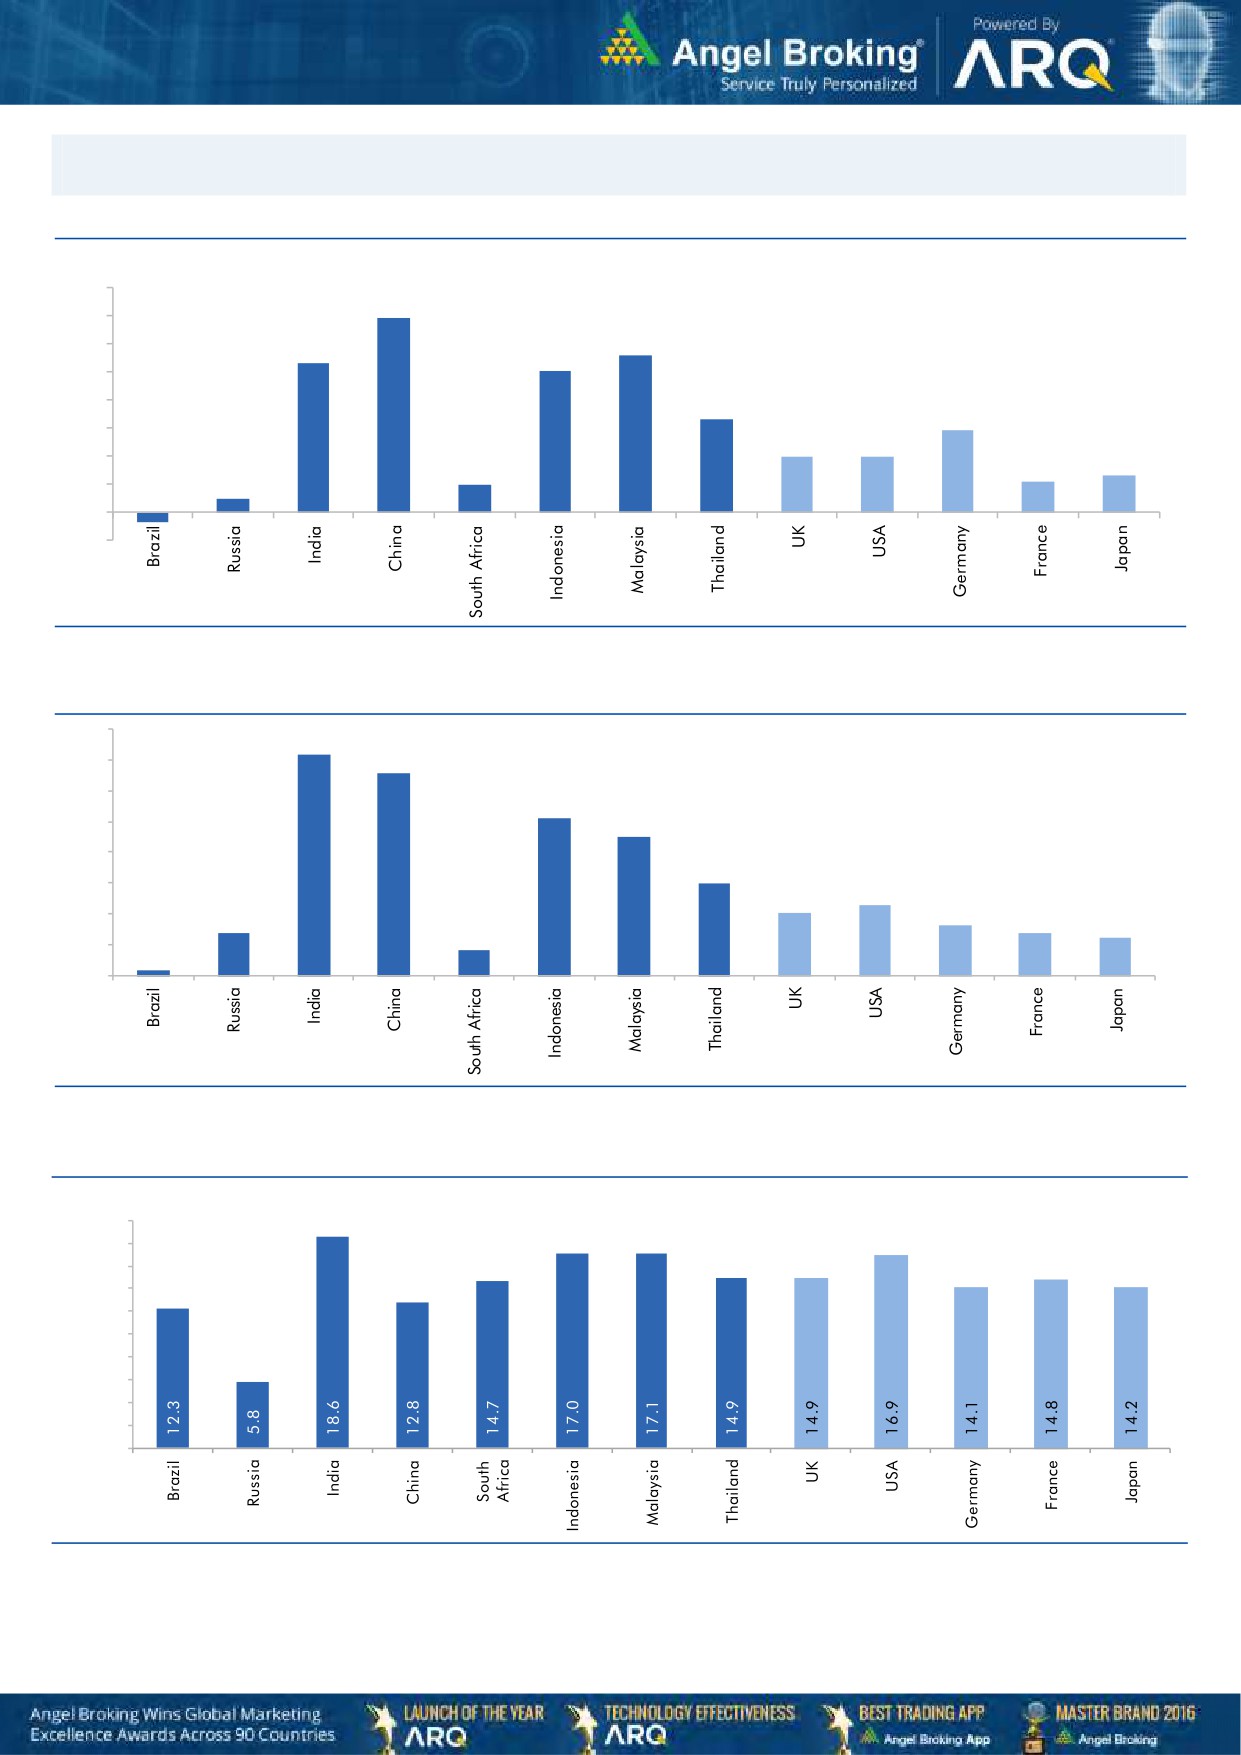
Exhibit 3: One year forward P-E ratio across select developing and developed countries
(x)
20.0
18.0
16.0
14.0
12.0
10.0
8.0
6.0
4.0
2.0
-
Source: IMF, Angel Research
Market Outlook
July 13, 2017
Exhibit 4: Relative performance of indices across globe
Returns (%)
C ountry
Name of index
Closing price
1M
3M
1YR
Brazil
Bovespa
63,832
1.7
(0.6)
22.7
Russia
Micex
1,938
3.8
(3.2)
0.6
India
Nifty
9,786
1.5
6.9
17.7
China
Shanghai Composite
3,203
1.8
(2.2)
9.1
South Africa
Top 40
46,193
1.2
0.6
3.4
Mexico
Mexbol
50,510
2.9
2.4
8.8
Indonesia
LQ45
967
1.5
5.4
17.2
Malaysia
KLCI
1,755
(2.0)
0.6
6.1
Thailand
SET 50
992
0.9
(0.4)
9.0
USA
Dow Jones
21,409
1.1
3.6
16.7
UK
FTSE
7,330
(2.6)
0.4
9.9
Japan
Nikkei
20,195
0.9
8.2
28.0
Germany
DAX
12,437
(1.3)
2.4
24.4
France
CAC
5,141
(1.0)
1.6
18.5
Source: Bloomberg, Angel Research,
Stock Watch
July 13, 2017
Company Name
Reco
CMP
Target
Mkt Cap
Sales ( Čcr )
OPM(%)
EPS (Č)
PER(x)
P/BV(x)
RoE(%)
EV/Sales(x)
(Č)
Price ( Č)
( Č cr )
FY17E FY18E
FY17E
FY18E
FY17E
FY18E
FY17E
FY18E
FY17E
FY18E
FY17E
FY18E
FY17E
FY18E
Agri / Agri Chemical
Rallis
Sell
251
209
4,875
1,937
2,164
13.3
14.3
9.0
11.0
27.9
22.8
4.9
4.2
18.4
19.8
2.6
2.3
United Phosphorus
Neutral
866
-
43,973
15,176
17,604
18.5
18.5
37.4
44.6
23.1
19.4
4.5
3.8
21.4
21.2
3.0
2.5
Auto & Auto Ancillary
Ashok Leyland
Accumulate
106
116
31,138
20,019
22,789
11.1
11.7
4.3
5.5
24.8
19.5
4.8
4.3
19.4
22.0
1.5
1.3
Bajaj Auto
Neutral
2,786
-
80,618
25,093
27,891
19.5
19.2
143.9
162.5
19.4
17.2
5.4
4.7
30.3
29.4
2.9
2.6
Bharat Forge
Neutral
1,119
-
26,058
7,726
8,713
20.5
21.2
35.3
42.7
31.7
26.2
5.9
5.3
18.9
20.1
3.4
3.0
Eicher Motors
Neutral
28,259
-
76,925
16,583
20,447
17.5
18.0
598.0
745.2
47.3
37.9
16.2
12.3
41.2
38.3
4.5
3.6
Gabriel India
Neutral
149
-
2,137
1,544
1,715
9.0
9.3
5.4
6.3
27.6
23.6
5.2
4.6
18.9
19.5
1.3
1.2
Hero Motocorp
Neutral
3,732
-
74,526
28,120
30,753
15.2
15.6
169.1
189.2
22.1
19.7
7.6
6.4
30.8
28.2
2.5
2.2
Jamna Auto Industries Neutral
260
-
2,068
1,486
1,620
9.8
9.9
15.0
17.2
17.3
15.1
3.8
3.2
21.8
21.3
1.5
1.3
L G Balakrishnan & Bros Neutral
785
-
1,233
1,302
1,432
11.6
11.9
43.7
53.0
18.0
14.8
2.5
2.3
13.8
14.2
1.0
0.9
Mahindra and Mahindra Neutral
1,377
-
85,500
46,534
53,077
11.6
11.7
67.3
78.1
20.5
17.6
3.3
2.9
15.4
15.8
1.8
1.6
Maruti
Accumulate
7,475
8,495
225,812
67,822
83,717
15.2
15.0
243.0
291.5
30.8
25.6
7.0
5.7
22.9
22.4
3.0
2.4
Minda Industries
Neutral
681
-
5,885
2,728
3,042
9.0
9.1
68.2
86.2
10.0
7.9
2.3
1.8
23.8
24.3
2.2
2.0
Motherson Sumi
Neutral
314
-
66,142
45,896
53,687
7.8
8.3
13.0
16.1
24.1
19.5
7.8
6.2
34.7
35.4
1.5
1.3
Rane Brake Lining
Neutral
1,340
-
1,061
511
562
11.3
11.5
28.1
30.9
47.7
43.4
7.3
6.6
15.3
15.0
2.2
2.0
Setco Automotive
Neutral
44
-
586
741
837
13.0
13.0
15.2
17.0
2.9
2.6
0.5
0.4
15.8
16.3
1.2
1.1
Tata Motors
Neutral
461
-
133,092
300,209
338,549
8.9
8.4
42.7
54.3
10.8
8.5
1.7
1.5
15.6
17.2
0.6
0.5
TVS Motor
Neutral
564
-
26,807
13,390
15,948
6.9
7.1
12.8
16.5
44.2
34.1
11.0
8.7
26.3
27.2
2.0
1.7
Amara Raja Batteries
Accumulate
852
962
14,556
5,339
6,220
15.9
15.3
28.0
32.3
30.4
26.4
5.8
4.9
19.1
18.5
2.7
2.3
Exide Industries
Neutral
226
-
19,240
7,439
8,307
15.0
15.0
8.1
9.3
27.9
24.3
3.9
3.5
14.3
16.7
2.2
2.0
Apollo Tyres
Neutral
252
-
12,840
12,877
14,504
14.3
13.9
21.4
23.0
11.8
11.0
1.8
1.6
16.4
15.2
1.2
1.1
Ceat
Neutral
1,880
-
7,603
7,524
8,624
13.0
12.7
131.1
144.3
14.3
13.0
2.6
2.2
19.8
18.6
1.1
1.0
JK Tyres
Neutral
170
-
3,865
7,455
8,056
15.0
15.0
21.8
24.5
7.8
7.0
1.6
1.3
22.8
21.3
0.6
0.6
Swaraj Engines
Neutral
2,215
-
2,751
660
810
15.2
16.4
54.5
72.8
40.6
30.4
12.7
11.5
31.5
39.2
4.0
3.2
Subros
Neutral
252
-
1,512
1,488
1,681
11.7
11.9
6.4
7.2
39.4
35.2
4.2
3.8
10.8
11.4
1.3
1.1
Indag Rubber
Neutral
209
-
550
286
326
19.8
16.8
11.7
13.3
17.9
15.7
3.0
2.8
17.8
17.1
1.6
1.4
Capital Goods
ACE
Neutral
72
-
716
709
814
4.1
4.6
1.4
2.1
51.7
34.5
2.1
2.0
4.4
6.0
1.2
1.0
BEML
Neutral
1,547
-
6,444
3,451
4,055
6.3
9.2
31.4
57.9
49.3
26.7
3.0
2.7
6.3
10.9
2.0
1.7
Bharat Electronics
Neutral
170
-
38,072
8,137
9,169
16.8
17.2
58.7
62.5
2.9
2.7
0.5
0.4
44.6
46.3
3.7
3.3
Stock Watch
July 13, 2017
Company Name
Reco
CMP
Target
Mkt Cap
Sales ( Čcr )
OPM(%)
EPS (Č)
PER(x)
P/BV(x)
RoE(%)
EV/Sales(x)
(Č)
Price ( Č)
( Č cr )
FY17E
FY18E
FY17E
FY18E
FY17E
FY18E
FY17E
FY18E
FY17E
FY18E
FY17E
FY18E
FY17E
FY18E
Capital Goods
Voltas
Neutral
474
-
15,667
6,511
7,514
7.9
8.7
12.9
16.3
36.7
29.1
6.6
5.8
16.7
18.5
2.2
1.8
BGR Energy
Neutral
155
-
1,119
16,567
33,848
6.0
5.6
7.8
5.9
19.9
26.3
1.1
1.1
4.7
4.2
0.2
0.1
BHEL
Neutral
140
-
34,364
28,797
34,742
-
2.8
2.3
6.9
61.0
20.4
1.0
1.0
1.3
4.8
0.8
0.6
Blue Star
Buy
618
760
5,910
4,283
5,077
5.9
7.3
14.9
22.1
41.5
27.9
8.1
6.8
20.4
26.4
1.4
1.2
CG Power and Industrial
Neutral
83
-
5,186
5,777
6,120
5.9
7.0
3.3
4.5
25.1
18.4
1.1
1.1
4.4
5.9
0.9
0.7
Solutions
Greaves Cotton
Neutral
160
-
3,904
1,755
1,881
16.8
16.9
7.8
8.5
20.5
18.8
4.1
3.8
20.6
20.9
1.9
1.7
Inox Wind
Neutral
147
-
3,254
5,605
6,267
15.7
16.4
24.8
30.0
5.9
4.9
1.7
1.2
25.9
24.4
0.6
0.5
KEC International
Neutral
278
-
7,141
9,294
10,186
7.9
8.1
9.9
11.9
28.1
23.3
4.1
3.6
15.6
16.3
1.0
0.9
KEI Industries
Accumulate
232
258
1,806
2,633
3,001
10.4
10.0
12.7
13.0
18.3
17.9
3.9
3.3
21.4
18.2
0.9
0.8
Thermax
Neutral
916
-
10,909
5,421
5,940
7.3
7.3
25.7
30.2
35.6
30.3
4.3
3.9
12.2
13.1
1.9
1.7
VATech Wabag
Neutral
676
-
3,689
3,136
3,845
8.9
9.1
26.0
35.9
26.0
18.8
3.3
2.8
13.4
15.9
1.1
0.9
Cement
ACC
Neutral
1,705
-
32,015
11,225
13,172
13.2
16.9
44.5
75.5
38.3
22.6
3.6
3.3
11.2
14.2
2.9
2.4
Ambuja Cements
Neutral
261
-
51,825
9,350
10,979
18.2
22.5
5.8
9.5
45.0
27.5
3.8
3.4
10.2
12.5
5.5
4.7
India Cements
Neutral
210
-
6,468
4,364
4,997
18.5
19.2
7.9
11.3
26.6
18.6
1.9
1.9
8.0
8.5
2.2
2.0
JK Cement
Neutral
970
-
6,782
4,398
5,173
15.5
17.5
31.2
55.5
31.1
17.5
3.7
3.2
12.0
15.5
2.1
1.7
J K Lakshmi Cement
Neutral
471
-
5,545
2,913
3,412
14.5
19.5
7.5
22.5
62.8
20.9
3.9
3.3
12.5
18.0
2.5
2.1
Orient Cement
Neutral
155
-
3,185
2,114
2,558
18.5
20.5
8.1
11.3
19.2
13.8
2.8
2.4
9.0
14.0
2.1
1.7
UltraTech Cement
Neutral
4,189
-
115,002
25,768
30,385
21.0
23.5
111.0
160.0
37.7
26.2
4.8
4.2
13.5
15.8
4.6
3.8
Construction
ITNL
Neutral
98
-
3,221
8,946
10,017
31.0
31.6
8.1
9.1
12.1
10.8
0.5
0.5
4.2
5.0
3.7
3.4
KNR Constructions
Neutral
219
-
3,086
1,385
1,673
14.7
14.0
41.2
48.5
5.3
4.5
1.0
0.9
14.9
15.2
2.3
1.9
Larsen & Toubro
Neutral
1,740
-
162,433
111,017
124,908
11.0
11.0
61.1
66.7
28.5
26.1
3.4
3.2
13.1
12.9
2.5
2.3
Gujarat Pipavav Port
Neutral
146
-
7,068
705
788
52.2
51.7
5.0
5.6
29.2
26.1
2.9
2.6
11.2
11.2
9.7
8.2
Nagarjuna Const.
Neutral
94
-
5,237
8,842
9,775
9.1
8.8
5.3
6.4
17.8
14.7
1.4
1.3
8.2
9.1
0.8
0.7
PNC Infratech
Neutral
149
-
3,834
2,350
2,904
13.1
13.2
9.0
8.8
16.6
17.0
0.6
0.5
15.9
13.9
1.8
1.4
Simplex Infra
Neutral
526
-
2,603
6,829
7,954
10.5
10.5
31.4
37.4
16.8
14.1
1.7
1.6
9.9
13.4
0.8
0.7
Power Mech Projects
Neutral
593
-
873
1,801
2,219
12.7
14.6
72.1
113.9
8.2
5.2
1.5
1.3
16.8
11.9
0.5
0.4
Sadbhav Engineering
Neutral
294
-
5,042
3,598
4,140
10.3
10.6
9.0
11.9
32.7
24.7
3.4
3.0
9.9
11.9
1.7
1.4
NBCC
Neutral
211
-
19,031
7,428
9,549
7.9
8.6
8.2
11.0
25.8
19.2
1.3
1.0
28.2
28.7
2.3
1.7
MEP Infra
Neutral
131
-
2,135
1,877
1,943
30.6
29.8
3.0
4.2
43.8
31.3
21.2
14.3
0.6
0.6
2.5
2.3
Stock Watch
July 13, 2017
Company Name
Reco
CMP
Target
Mkt Cap
Sales ( Čcr )
OPM(%)
EPS (Č)
PER(x)
P/BV(x)
RoE(%)
EV/Sales(x)
(Č)
Price ( Č)
( Č cr )
FY17E
FY18E
FY17E
FY18E
FY17E
FY18E
FY17E
FY18E
FY17E
FY18E
FY17E
FY18E
FY17E
FY18E
Construction
SIPL
Neutral
107
-
3,769
1,036
1,252
65.5
66.2
(8.4)
(5.6)
4.0
4.6
(22.8)
(15.9)
11.9
9.9
Engineers India
Neutral
157
-
10,576
1,725
1,935
16.0
19.1
11.4
13.9
13.8
11.3
1.9
1.8
13.4
15.3
5.1
4.5
Financials
Axis Bank
Accumulate
507
580
121,608
46,932
53,575
3.5
3.4
32.4
44.6
15.7
11.4
2.0
1.8
13.6
16.5
-
-
Bank of Baroda
Neutral
163
-
37,662
19,980
23,178
1.8
1.8
11.5
17.3
14.2
9.5
1.6
1.3
8.3
10.1
-
-
Canara Bank
Neutral
360
-
21,499
15,225
16,836
1.8
1.8
14.5
28.0
24.8
12.9
1.7
1.4
5.8
8.5
-
-
Can Fin Homes
Neutral
3,202
-
8,523
420
526
3.5
3.5
86.5
107.8
37.0
29.7
8.0
6.5
23.6
24.1
-
-
Cholamandalam Inv. &
Accumulate
1,111
1,230
17,366
2,012
2,317
6.3
6.3
42.7
53.6
26.0
20.7
4.1
3.5
16.9
18.3
-
-
Fin. Co.
Dewan Housing Finance Buy
435
520
13,636
2,225
2,688
2.9
2.9
29.7
34.6
14.6
12.6
2.4
1.6
16.1
14.8
-
-
Equitas Holdings
Buy
168
235
5,683
939
1,281
11.7
11.5
5.8
8.2
29.0
20.5
2.5
2.2
10.9
11.5
-
-
Federal Bank
Accumulate
115
125
22,335
8,259
8,995
3.0
3.0
4.3
5.6
26.7
20.5
2.3
2.1
8.5
10.1
-
-
HDFC
Neutral
1,640
-
261,203
11,475
13,450
3.4
3.4
45.3
52.5
36.2
31.2
7.0
6.2
20.2
20.5
-
-
HDFC Bank
Neutral
1,681
-
432,657
46,097
55,433
4.5
4.5
58.4
68.0
28.8
24.7
5.1
4.2
18.8
18.6
-
-
ICICI Bank
Accumulate
293
315
187,736
42,800
44,686
3.1
3.3
18.0
21.9
16.3
13.4
2.2
2.1
11.1
12.3
-
-
Karur Vysya Bank
Buy
138
160
8,340
5,640
6,030
3.3
3.2
8.9
10.0
15.5
13.8
1.6
1.5
11.2
11.4
-
-
Lakshmi Vilas Bank
Neutral
204
-
3,909
3,339
3,799
2.7
2.8
11.0
14.0
18.5
14.6
1.9
1.8
11.2
12.7
-
-
LIC Housing Finance
Neutral
726
-
36,631
3,712
4,293
2.6
2.5
39.0
46.0
18.6
15.8
3.5
3.0
19.9
20.1
-
-
Punjab Natl.Bank
Neutral
152
-
32,366
23,532
23,595
2.3
2.4
6.8
12.6
22.4
12.1
3.5
2.5
3.3
6.5
-
-
RBL Bank
Neutral
534
-
20,125
1,783
2,309
2.6
2.6
12.7
16.4
42.1
32.6
4.6
4.1
12.8
13.3
-
-
Repco Home Finance
Neutral
793
-
4,962
388
457
4.5
4.2
30.0
38.0
26.4
20.9
4.4
3.7
18.0
19.2
-
-
South Ind.Bank
Neutral
28
-
5,095
6,435
7,578
2.5
2.5
2.7
3.1
10.5
9.1
1.4
1.1
10.1
11.2
-
-
St Bk of India
Neutral
287
-
248,085
88,650
98,335
2.6
2.6
13.5
18.8
21.3
15.3
2.0
1.8
7.0
8.5
-
-
Union Bank
Neutral
154
-
10,600
13,450
14,925
2.3
2.3
25.5
34.5
6.1
4.5
0.9
0.8
7.5
10.2
-
-
Yes Bank
Neutral
1,515
-
69,300
8,978
11,281
3.3
3.4
74.0
90.0
20.5
16.8
3.9
3.3
17.0
17.2
-
-
FMCG
Akzo Nobel India
Neutral
1,810
-
8,681
2,955
3,309
13.3
13.7
57.2
69.3
31.7
26.1
10.3
8.7
32.7
33.3
2.7
2.4
Asian Paints
Neutral
1,133
-
108,648
17,128
18,978
16.8
16.4
19.1
20.7
59.3
54.7
20.6
19.5
34.8
35.5
6.3
5.7
Britannia
Neutral
3,701
-
44,432
9,594
11,011
14.6
14.9
80.3
94.0
46.1
39.4
19.0
14.6
41.2
-
4.5
3.9
Colgate
Neutral
1,076
-
29,260
4,605
5,149
23.4
23.4
23.8
26.9
45.2
40.0
25.0
19.6
64.8
66.8
6.3
5.6
Dabur India
Neutral
304
-
53,621
8,315
9,405
19.8
20.7
8.1
9.2
37.6
33.1
10.5
8.7
31.6
31.0
6.1
5.4
GlaxoSmith Con*
Neutral
5,515
-
23,195
4,350
4,823
21.2
21.4
179.2
196.5
30.8
28.1
8.2
6.9
27.1
26.8
4.7
4.2
Stock Watch
July 13, 2017
Company Name
Reco
CMP
Target
Mkt Cap
Sales ( Čcr )
OPM(%)
EPS (Č)
PER(x)
P/BV(x)
RoE(%)
EV/Sales(x)
(Č)
Price ( Č)
( Č cr )
FY17E FY18E
FY17E
FY18E
FY17E
FY18E
FY17E
FY18E
FY17E
FY18E
FY17E
FY18E
FY17E
FY18E
FMCG
Godrej Consumer
Neutral
968
-
65,927
10,235
11,428
18.4
18.6
41.1
44.2
23.6
21.9
5.2
4.4
24.9
24.8
6.5
5.8
HUL
Neutral
1,130
-
244,520
35,252
38,495
17.8
17.8
20.7
22.4
54.7
50.5
52.3
44.9
95.6
88.9
6.8
6.2
ITC
Neutral
329
-
399,442
40,059
44,439
38.3
39.2
9.0
10.1
36.6
32.4
10.2
8.9
27.8
27.5
9.5
8.5
Marico
Neutral
324
-
41,869
6,430
7,349
18.8
19.5
6.4
7.7
50.7
42.1
15.3
12.9
33.2
32.5
6.3
5.5
Nestle*
Neutral
6,820
-
65,756
10,073
11,807
20.7
21.5
124.8
154.2
54.7
44.2
22.4
20.2
34.8
36.7
6.3
5.4
Tata Global
Neutral
173
-
10,941
8,675
9,088
9.8
9.8
7.4
8.2
23.4
21.1
1.9
1.8
7.9
8.1
1.2
1.1
Procter & Gamble
Neutral
8,015
-
26,017
2,939
3,342
23.2
23.0
146.2
163.7
54.8
49.0
13.9
11.5
25.3
23.5
8.4
7.3
Hygiene
IT
HCL Tech^
Buy
853
1,014
121,722
46,723
52,342
22.1
20.9
60.0
62.8
14.2
13.6
3.6
3.1
25.3
22.4
2.3
2.0
Infosys
Buy
974
1,179
223,677
68,484
73,963
26.0
26.0
63.0
64.0
15.5
15.2
3.3
3.0
20.8
19.7
2.9
2.6
TCS
Accumulate
2,439
2,651
480,607
117,966
127,403
27.5
27.6
134.3
144.5
18.2
16.9
5.4
5.0
29.8
29.7
3.7
3.5
Tech Mahindra
Buy
387
533
37,706
29,141
31,051
14.4
15.0
32.3
35.6
12.0
10.9
2.1
1.8
17.1
17.0
1.1
1.0
Wipro
Accumulate
264
280
128,442
55,421
58,536
20.3
20.3
35.1
36.5
7.5
7.2
1.3
1.1
19.2
14.6
1.7
1.5
Media
D B Corp
Neutral
381
-
7,011
2,297
2,590
27.4
28.2
21.0
23.4
18.2
16.3
4.2
3.7
23.7
23.1
2.9
2.5
HT Media
Neutral
83
-
1,924
2,693
2,991
12.6
12.9
7.9
9.0
10.5
9.2
0.9
0.8
7.8
8.3
0.3
0.2
Jagran Prakashan
Buy
178
225
5,804
2,283
2,555
28.0
28.0
10.6
12.3
16.7
14.5
3.6
3.1
21.4
21.4
2.6
2.2
Sun TV Network
Neutral
828
-
32,612
2,850
3,265
70.1
71.0
26.2
30.4
31.6
27.2
8.1
7.1
24.3
25.6
11.0
9.5
Hindustan Media
Neutral
276
-
2,025
1,016
1,138
24.3
25.2
27.3
30.1
10.1
9.2
1.9
1.7
16.2
15.8
1.3
1.1
Ventures
TV Today Network
Buy
255
344
1,522
608
667
21.5
22.3
15.7
19.2
16.3
13.3
2.5
2.1
16.1
16.0
2.1
1.8
Metals & Mining
Coal India
Neutral
254
-
157,513
84,638
94,297
21.4
22.3
24.5
27.1
10.4
9.4
4.3
4.1
42.6
46.0
1.4
1.2
Hind. Zinc
Neutral
273
-
115,288
14,252
18,465
55.9
48.3
15.8
21.5
17.3
12.7
2.8
2.5
17.0
20.7
8.1
6.2
Hindalco
Neutral
201
-
44,991
107,899
112,095
7.4
8.2
9.2
13.0
21.8
15.4
1.1
1.0
4.8
6.6
0.9
0.9
JSW Steel
Neutral
214
-
51,789
53,201
58,779
16.1
16.2
130.6
153.7
1.6
1.4
0.2
0.2
14.0
14.4
1.7
1.5
NMDC
Neutral
119
-
37,793
6,643
7,284
44.4
47.7
7.1
7.7
16.8
15.5
1.5
1.4
8.8
9.2
3.5
3.1
SAIL
Neutral
62
-
25,648
47,528
53,738
(0.7)
2.1
(1.9)
2.6
23.9
0.7
0.7
(1.6)
3.9
1.4
1.3
Vedanta
Neutral
260
-
96,610
71,744
81,944
19.2
21.7
13.4
20.1
19.4
12.9
1.7
1.5
8.4
11.3
1.7
1.4
Tata Steel
Neutral
559
-
54,276
121,374
121,856
7.2
8.4
18.6
34.3
30.1
16.3
1.9
1.7
6.1
10.1
1.1
1.1
Oil & Gas
GAIL
Neutral
370
-
62,587
56,220
65,198
9.3
10.1
27.1
33.3
13.7
11.1
1.3
1.2
9.3
10.7
1.3
1.1
ONGC
Neutral
163
-
208,989
137,222
152,563
15.0
21.8
19.5
24.1
8.4
6.8
0.7
0.7
8.5
10.1
1.8
1.6
Indian Oil Corp
Neutral
393
-
190,643
373,359
428,656
5.9
5.5
54.0
59.3
7.3
6.6
1.1
1.0
16.0
15.6
0.7
0.6
Stock Watch
July 13, 2017
Company Name
Reco
CMP
Target
Mkt Cap
Sales ( Čcr )
OPM(%)
EPS (Č)
PER(x)
P/BV(x)
RoE(%)
EV/Sales(x)
(Č)
Price ( Č)
( Č cr )
FY17E FY18E
FY17E
FY18E
FY17E
FY18E
FY17E
FY18E
FY17E
FY18E
FY17E
FY18E
FY17E
FY18E
Oil & Gas
Reliance Industries
Neutral
1,511
-
491,149
301,963
358,039
12.1
12.6
87.7
101.7
17.2
14.9
1.8
1.6
10.7
11.3
2.1
1.8
Pharmaceuticals
Alembic Pharma
Buy
526
648
9,924
3,101
3,966
19.7
20.5
21.4
25.5
24.6
20.7
5.2
4.3
23.0
22.8
3.2
2.3
Alkem Laboratories Ltd
Buy
1,802
2,161
21,541
5,853
6,901
17.1
18.4
74.6
85.0
24.1
21.2
5.1
4.3
21.1
20.2
3.7
3.1
Aurobindo Pharma
Buy
695
823
40,704
14,845
17,086
21.5
22.1
39.4
44.7
17.6
15.5
4.3
3.4
27.6
24.7
2.9
2.5
Aventis*
Neutral
4,189
-
9,649
2,206
2,508
16.6
16.8
128.9
139.9
32.5
30.0
5.6
4.4
21.6
23.5
4.1
3.5
Cadila Healthcare
Reduce
517
450
52,907
9,220
11,584
18.4
20.3
14.5
18.7
35.6
27.6
7.6
6.2
23.5
24.6
6.1
4.6
Cipla
Reduce
539
461
43,382
14,281
16,619
15.4
16.2
12.5
19.7
43.1
27.4
3.5
3.1
8.4
12.0
3.2
2.7
Dr Reddy's
Neutral
2,689
-
44,572
14,081
15,937
16.1
18.6
72.6
105.9
37.0
25.4
3.6
3.3
9.6
13.6
3.4
3.0
Dishman Pharma
Sell
143
1,718
1,890
22.7
22.8
9.5
11.3
10.1
10.9
3.3
2.9
GSK Pharma*
Neutral
2,586
-
21,902
2,927
3,290
11.8
16.2
34.4
49.6
75.2
52.1
10.9
11.3
13.9
21.3
7.3
6.5
Indoco Remedies
Sell
200
153
1,847
1,067
1,154
12.1
14.9
8.4
11.3
23.9
17.7
2.8
2.5
12.6
15.0
1.9
1.8
Ipca labs
Buy
475
620
5,993
3,211
3,593
13.9
14.5
15.4
19.4
30.8
24.5
2.4
2.2
8.2
9.5
2.0
1.7
Lupin
Buy
1,140
1,526
51,512
17,120
18,657
24.1
24.1
56.9
61.1
20.0
18.7
3.8
3.2
20.7
18.6
3.3
2.7
Natco Pharma
Accumulate
995
1,060
17,347
2,065
1,988
33.1
33.7
27.9
25.7
35.7
38.7
10.4
8.9
29.2
22.9
8.5
8.6
Sun Pharma
Buy
562
712
134,898
30,264
32,899
29.0
26.9
32.7
31.6
17.2
17.8
3.7
3.1
22.2
18.7
4.2
3.7
Power
Tata Power
Neutral
83
-
22,463
36,916
39,557
17.4
27.1
5.1
6.3
16.3
13.2
1.4
1.3
9.0
10.3
1.6
1.5
NTPC
Neutral
164
-
134,896
86,605
95,545
17.5
20.8
11.8
13.4
13.9
12.2
1.4
1.3
10.5
11.1
2.9
2.9
Power Grid
Neutral
214
-
111,982
25,315
29,193
88.2
88.7
14.2
17.2
15.1
12.5
2.3
2.0
15.2
16.1
9.1
8.1
Real Estate
Prestige Estate
Neutral
283
-
10,624
4,707
5,105
25.2
26.0
10.3
13.0
27.5
21.8
2.2
2.1
10.3
10.2
3.4
3.1
MLIFE
Buy
441
522
2,263
1,152
1,300
22.7
24.6
29.9
35.8
14.8
12.3
1.1
1.0
7.6
8.6
2.7
2.3
Telecom
Bharti Airtel
Neutral
397
-
158,777
105,086
114,808
34.5
34.7
12.2
16.4
32.6
24.2
2.2
2.1
6.8
8.4
2.4
2.1
Idea Cellular
Neutral
86
-
30,832
40,133
43,731
37.2
37.1
6.4
6.5
13.4
13.2
1.1
1.0
8.2
7.6
1.8
1.5
zOthers
Abbott India
Neutral
4,361
-
9,268
3,153
3,583
14.1
14.4
152.2
182.7
28.7
23.9
140.7
120.2
25.6
26.1
2.7
2.3
Asian Granito
Accumulate
447
480
1,346
1,066
1,169
11.6
12.5
13.0
16.0
34.4
28.0
3.4
3.0
9.5
10.7
1.6
1.4
Bajaj Electricals
Buy
335
395
3,395
4,801
5,351
5.7
6.2
10.4
13.7
32.1
24.5
4.0
3.5
12.4
14.5
0.7
0.6
Banco Products (India)
Neutral
222
-
1,589
1,353
1,471
12.3
12.4
14.5
16.3
15.3
13.6
21.2
19.1
14.5
14.6
1.1
119.8
Coffee Day Enterprises
Neutral
244
-
5,022
2,964
3,260
20.5
21.2
4.7
8.0
-
30.5
2.8
2.6
5.5
8.5
2.1
1.9
Ltd
Competent Automobiles Neutral
190
-
122
1,137
1,256
3.1
2.7
28.0
23.6
6.8
8.1
36.5
33.0
14.3
11.5
0.1
0.1
Elecon Engineering
Neutral
61
-
680
1,482
1,660
13.7
14.5
3.9
5.8
15.6
10.5
3.7
3.4
7.8
10.9
0.8
0.7
Stock Watch
July 13, 2017
Company Name
Reco
CMP
Target
Mkt Cap
Sales ( Čcr )
OPM(%)
EPS (Č)
PER(x)
P/BV(x)
RoE(%)
EV/Sales(x)
(Č)
Price ( Č)
( Č cr )
FY17E
FY18E
FY17E
FY18E
FY17E
FY18E
FY17E
FY18E
FY17E
FY18E
FY17E
FY18E
FY17E
FY18E
zOthers
Finolex Cables
Neutral
490
-
7,494
2,883
3,115
12.0
12.1
14.2
18.6
34.5
26.3
18.4
16.0
15.8
14.6
2.3
2.1
Garware Wall Ropes
Neutral
966
-
2,115
863
928
15.1
15.2
36.4
39.4
26.6
24.5
4.8
4.1
17.5
15.9
2.4
2.2
Goodyear India*
Neutral
915
-
2,112
1,598
1,704
10.4
10.2
49.4
52.6
18.5
17.4
85.6
75.1
18.2
17.0
1.0
144.1
Hitachi
Neutral
1,987
-
5,402
2,081
2,433
8.8
8.9
33.4
39.9
59.5
49.8
48.0
40.0
22.1
21.4
2.6
2.2
HSIL
Neutral
391
-
2,828
2,384
2,515
15.8
16.3
15.3
19.4
25.6
20.2
25.4
21.9
7.8
9.3
1.4
1.2
Interglobe Aviation
Neutral
1,263
-
45,663
21,122
26,005
14.5
27.6
110.7
132.1
11.4
9.6
68.3
48.8
168.5
201.1
2.1
1.7
Jyothy Laboratories
Neutral
367
-
6,670
1,440
2,052
11.5
13.0
8.5
10.0
43.2
36.7
10.5
9.7
18.6
19.3
4.9
3.4
Kirloskar Engines India
Neutral
390
-
5,645
2,554
2,800
9.9
10.0
10.5
12.1
37.2
32.3
15.6
14.7
10.7
11.7
1.9
1.7
Ltd
Linc Pen & Plastics
Neutral
274
-
405
382
420
9.3
9.5
13.5
15.7
20.4
17.5
3.5
3.0
17.1
17.3
1.1
1.0
M M Forgings
Neutral
648
-
782
546
608
20.4
20.7
41.3
48.7
15.7
13.3
88.7
78.5
16.6
17.0
1.3
1.1
Manpasand Bever.
Neutral
761
-
4,353
836
1,087
19.6
19.4
16.9
23.8
45.0
32.0
5.4
4.7
12.0
14.8
4.9
3.7
Mirza International
Neutral
158
-
1,903
963
1,069
17.2
18.0
6.1
7.5
25.8
21.1
3.9
3.4
15.0
15.7
2.2
2.0
MT Educare
Neutral
78
-
310
366
417
17.7
18.2
9.4
10.8
8.3
7.2
1.9
1.6
22.2
22.3
0.8
0.6
Narayana Hrudaya
Neutral
304
-
6,222
1,873
2,166
11.5
11.7
2.6
4.0
115.1
76.8
7.1
6.4
6.1
8.3
3.4
2.9
Navkar Corporation
Buy
206
265
2,938
347
371
43.2
37.3
6.7
6.0
30.9
34.4
2.1
1.9
6.2
10.6
9.6
9.0
Navneet Education
Neutral
176
-
4,109
1,062
1,147
24.0
24.0
6.1
6.6
28.9
26.6
5.9
5.3
20.6
19.8
3.9
3.7
Nilkamal
Neutral
1,919
-
2,864
1,995
2,165
10.7
10.4
69.8
80.6
27.5
23.8
109.7
95.3
16.6
16.5
1.4
1.3
Page Industries
Neutral
16,589
-
18,503
2,450
3,124
20.1
17.6
299.0
310.0
55.5
53.5
369.5
282.0
47.1
87.5
7.6
6.0
Parag Milk Foods
Neutral
234
-
1,966
1,919
2,231
9.3
9.6
9.5
12.9
24.7
18.1
3.8
3.2
15.5
17.5
1.2
1.0
Quick Heal
Neutral
223
-
1,563
408
495
27.3
27.0
7.7
8.8
28.8
25.3
2.7
2.7
9.3
10.6
3.0
2.5
Radico Khaitan
Accumulate
135
147
1,798
1,667
1,824
13.0
13.2
6.7
8.2
20.3
16.5
1.8
1.7
9.0
10.2
1.5
1.3
Relaxo Footwears
Neutral
519
-
6,229
2,085
2,469
9.2
8.2
7.6
8.0
68.6
65.3
26.6
22.7
17.9
18.8
3.1
2.6
S H Kelkar & Co.
Neutral
268
-
3,869
1,036
1,160
15.1
15.0
6.1
7.2
43.8
37.3
4.7
4.3
10.7
11.5
3.6
3.2
Siyaram Silk Mills
Accumulate
2,303
2,500
2,158
1,574
1,769
12.5
12.7
97.1
113.1
23.7
20.4
3.6
3.2
15.4
15.5
1.6
1.4
Styrolution ABS India*
Neutral
923
-
1,623
1,440
1,537
9.2
9.0
40.6
42.6
22.7
21.7
58.1
52.8
12.3
11.6
1.1
1.0
Surya Roshni
Neutral
284
-
1,245
3,342
3,625
7.8
7.5
17.3
19.8
16.5
14.4
31.2
25.1
10.5
10.8
0.6
0.6
Team Lease Serv.
Neutral
1,520
-
2,598
3,229
4,001
1.5
1.8
22.8
32.8
66.8
46.3
7.2
6.2
10.7
13.4
0.7
0.6
The Byke Hospitality
Neutral
191
-
767
287
384
20.5
20.5
7.6
10.7
25.2
17.9
5.3
4.3
20.7
23.5
2.7
2.0
Transport Corporation of
Neutral
340
-
2,604
2,671
2,911
8.5
8.8
13.9
15.7
24.5
21.7
3.4
3.0
13.7
13.8
1.1
1.0
India
Stock Watch
July 13, 2017
Company Name
Reco
CMP
Target Mkt Cap
Sales ( Čcr )
OPM(%)
EPS (Č)
PER(x)
P/BV(x)
RoE(%)
EV/Sales(x)
(Č)
Price ( Č)
( Č cr )
FY17E FY18E FY17E FY18E FY17E FY18E FY17E FY18E FY17E FY18E FY17E FY18E FY17E FY18E
zOthers
TVS Srichakra
Neutral
3,830
-
2,933
2,304
2,614
13.7
13.8
231.1
266.6
16.6
14.4
430.3
338.8
33.9
29.3
1.3
1.1
UFO Moviez
Neutral
393
-
1,085
619
685
33.2
33.4
30.0
34.9
13.1
11.3
1.8
1.6
13.8
13.9
1.5
1.1
Visaka Industries
Neutral
528
-
839
1,051
1,138
10.3
10.4
21.0
23.1
25.1
22.8
67.7
63.4
9.0
9.2
1.1
1.0
VRL Logistics
Neutral
326
-
2,978
1,902
2,119
16.7
16.6
14.6
16.8
22.4
19.4
4.9
4.3
21.9
22.2
1.7
1.5
VIP Industries
Buy
185
218
2,614
1,270
1,450
10.4
10.4
5.6
6.5
33.0
28.5
6.9
6.0
20.7
21.1
2.1
1.8
Navin Fluorine
Accumulate
3,260
3,650
3,208
789
945
21.1
22.4
120.1
143.4
27.1
22.7
4.4
3.8
17.8
18.5
4.0
3.3
Source: Company, Angel Research; Note: *December year end; #September year end; &October year end; Price as on July 12, 2017
Market Outlook
July 13, 2017
Research Team Tel: 022 - 39357800
DISCLAIMER
Angel Broking Private Limited (hereinafter referred to as “Angel”) is a registered Member of National Stock Exchange of India
Limited,Bombay Stock Exchange Limited and Metropolitan Stock Exchange Limited. It is also registered as a Depository Participant with
CDSL and Portfolio Manager with SEBI. It also has registration with AMFI as a Mutual Fund Distributor. Angel Broking Private Limited is a
registered entity with SEBI for Research Analyst in terms of SEBI (Research Analyst) Regulations, 2014 vide registration number
INH000000164. Angel or its associates has not been debarred/ suspended by SEBI or any other regulatory authority for accessing
/dealing in securities Market. Angel or its associates/analyst has not received any compensation / managed or
co-managed public offering of securities of the company covered by Analyst during the past twelve months.
This document is solely for the personal information of the recipient, and must not be singularly used as the basis of any investment
decision. Nothing in this document should be construed as investment or financial advice. Each recipient of this document should make
such investigations as they deem necessary to arrive at an independent evaluation of an investment in the securities of the companies
referred to in this document (including the merits and risks involved), and should consult their own advisors to determine the merits and
risks of such an investment.
Reports based on technical and derivative analysis center on studying charts of a stock's price movement, outstanding positions and
trading volume, as opposed to focusing on a company's fundamentals and, as such, may not match with a report on a company's
fundamentals. Investors are advised to refer the Fundamental and Technical Research Reports available on our website to evaluate the
contrary view, if any.
The information in this document has been printed on the basis of publicly available information, internal data and other reliable
sources believed to be true, but we do not represent that it is accurate or complete and it should not be relied on as such, as this
document is for general guidance only. Angel Broking Pvt. Limited or any of its affiliates/ group companies shall not be in any way
responsible for any loss or damage that may arise to any person from any inadvertent error in the information contained in this report.
Angel Broking Pvt. Limited has not independently verified all the information contained within this document. Accordingly, we cannot
testify, nor make any representation or warranty, express or implied, to the accuracy, contents or data contained within this document.
While Angel Broking Pvt. Limited endeavors to update on a reasonable basis the information discussed in this material, there may be
regulatory, compliance, or other reasons that prevent us from doing so.
This document is being supplied to you solely for your information, and its contents, information or data may not be reproduced,
redistributed or passed on, directly or indirectly.
Neither Angel Broking Pvt. Limited, nor its directors, employees or affiliates shall be liable for any loss or damage that may arise from
or in connection with the use of this information.